
Data Access Opportunities for Self-Insured Employers
Federal healthcare price transparency rules enable employers to benchmark their healthcare costs and identify opportunities for savings.
Managing healthcare costs and benefits effectively requires clear, comprehensive data, yet this remains a persistent challenge for ERISA plans.
Despite new legal and regulatory momentum for data transparency, particularly through the Consolidated Appropriations Act of 2021, large self-insured employers continue to face systemic barriers to information. Vendors—including carriers, third-party administrators (TPAs), and carve-out partners—tightly control claims data, limiting access to critical details like itemized claims, provider-level performance, negotiated rates, and utilization patterns. They sometimes use separate data-sharing agreements to sidestep gag clause prohibitions and restrict access based on “confidentiality” or “proprietary information.”
Large self-insured employers struggle for access to healthcare cost and utilization data, leaving them reliant on their vendors to be transparent—a situation that can increase expenses and undermine bargaining power.
The federal Hospital Price Transparency and Transparency in Coverage rules have unleashed vast amounts of healthcare rate, pricing, and reimbursement data. Combined with claims data, this information enables analyses of vendor performance, claims spend benchmarking, and cost savings identification.
The Trump administration is pushing for even more transparency on drug pricing, eyeing revival of the Prescription Drug File that was initially to be featured in the Transparency in Coverage Rule.
Compounding the problem, self-funded plans depend on multiple vendors across services such as medical, pharmacy, vision, and behavioral health—each using its own systems and reporting standards. Consolidating these fragmented data feeds is cumbersome, and inconsistencies in coding and timing make true plan-wide analysis nearly impossible.
Impact on Plan Management and Control
Without access to detailed claims and pricing data, employers and consultants are forced to trust vendors’ assurances rather than validating their performance—potentially resulting in higher costs and weakened bargaining power. These effects ripple through all aspects of plan management.
Inability to benchmark pricing. Without seeing underlying negotiated rates or allowed amounts, employers can’t easily tell if their network deals are competitive. A plan might believe it has steep discounts (i.e., “We pay X% of Medicare rates”), but that percentage is often computed on aggregate and can be misleading. A single high-volume hospital can skew the average (See Figure 1). Also, most historical analyses rely on aggregated “discount off charges” metrics (reflecting paid claims after adjustments) that hide provider-level detail.
Limited accountability for carve-outs. When pharmacy or other benefits are carved out, employers often lose visibility into how vendors manage costs. For example, a pharmacy benefit manager (PBM) might only provide high-level reports on drug use and rebates, rather than detailed claims data. Without access to this information, employers and consultants can’t verify if drug pricing models are in line with Medicare and commercial market benchmarks.
Vendor management challenges. With only partial claims data and no ability to calculate actual commercial market average rates, it is difficult to identify which vendors are adding value. For instance, a case manager or disease management program might be in place, but its pricing model and impact can’t be measured. In short, lack of transparency makes it impossible to enforce performance guarantees: is your vendor “earning” its fees or simply passing through costs?
Leveraging Transparency Data for Benchmarking
Federal price transparency mandates represent a major shift in the traditional information imbalance in healthcare. Thanks to the federal Hospital Price Transparency and Transparency in Coverage (TiC) rules, we now have access to a wealth of previously hidden information—machine-readable files (MRFs) with millions of negotiated rates, cash prices, and reimbursement terms between providers and payers. For the first time, employers can analyze and compare real prices, shining a light on what they are actually paying for healthcare services.
On its own, price transparency data is a powerful tool for drawing attention to never-seen-before contracts and market rates and for spotting pricing variations. Employers can see the range of costs for the same services across different providers and payers, which helps inform high-level strategy and highlight opportunities for smarter network and benefit design.
But when combined with an employer’s claims data, the opportunity becomes even more granular, delivering specialized insights to employers based on their utilization profile and population’s geographic footprint. Together, transparency and claims data create a full picture that enables employers to:
- Audit TPA and carve-out vendor performance more effectively;
- Benchmark projected claims spend within their products against competitors and regional and national averages;
- Identify cost-saving opportunities tied directly to employee behavior and utilization patterns; and
- Strengthen negotiations with vendors, especially when traditional reporting is limited or restricted.
The following emerging applications of this data offer opportunities for better insight into TPAs, drug pricing, and care management models.
Additive, Granular Insight for TPA Selection
Which TPA has negotiated the lowest payment rates in my market(s)?
Employer decision-making around health plan administration is increasingly informed by new sources of data, particularly those enabled by recent price transparency regulations.
As noted previously, one important application of transparency data is improving the ability to compare cost differences across TPAs. This data complements traditional methods, which typically rely on blinded historical claims, by adding provider-specific insights that were previously unavailable. Furthermore, transparency data allows for more tailored analyses, enabling employers to adjust for their own utilization patterns—either by reweighting service categories or by narrowing the focus to only the providers their employees currently use.
This analysis is especially powerful in a market where an employer’s population largely uses one or two facilities or where certain facilities have significant differences in negotiated rates that may be masked when aggregated across a 3-digit ZIP code or metro area. It gives employers a sharper lens through which to evaluate the financial impact of one TPA over another—helping to align provider utilization within employer populations with cost-containment goals.
Figure 1 shows how much two different TPA networks pay for inpatient services at four major hospitals in the Denver-Aurora area. Unlike traditional analyses that average costs across broad ZIP codes, this provider-level view reveals significant differences in what each TPA has negotiated. For instance, TPA Network B has consistently lower rates than TPA Network A at three of the four hospitals: Catholic Health Initiatives, CommonSpirit St. Anthony, and HCA HealthONE Presbyterian St. Luke’s. However, both TPAs pay similarly high rates at the University of Colorado Hospital, making it a clear outlier. These insights help employers pinpoint where switching TPAs could result in real cost savings, especially if their employees regularly visit the more expensive facilities.

How Do TPA Networks Compare?
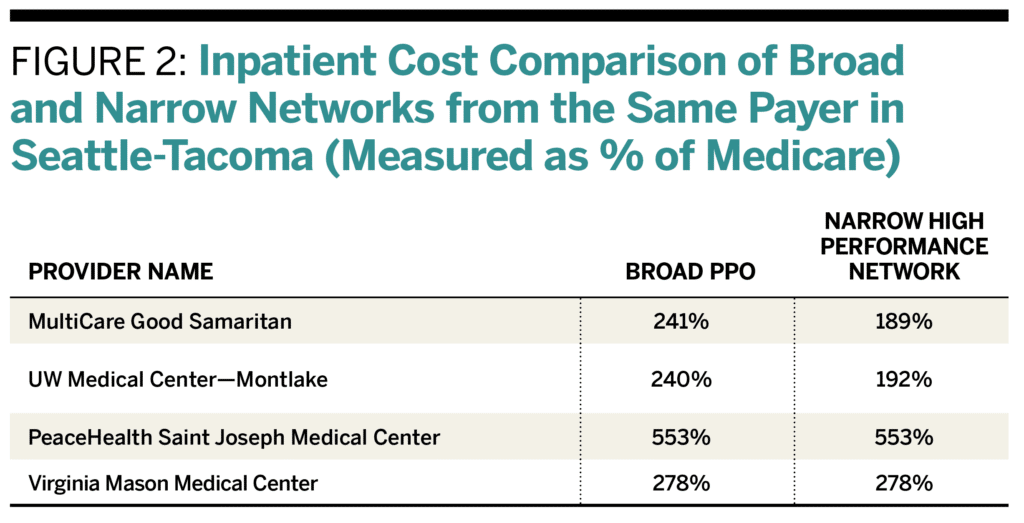
Transparency data also enables analysis of cost differences across various networks offered by the same payer. Payers frequently provide multiple network options depending on the product type—such as a health maintenance organization (HMO) versus a preferred provider organization (PPO)—and the network’s size, whether narrow or broad. Many also promote “high performance” or “narrow” networks that feature lower negotiated rates with select hospitals or health systems. Transparency data now enables a level of insight into these network structures that was previously unattainable.
Figure 2 shows that the narrow high-performance network often has lower inpatient rates than the broad PPO—for example, 189% versus 241% of Medicare at MultiCare Good Samaritan in Puyallup, Washington. However, some nearby hospitals like PeaceHealth and Virginia Mason charge the same high rates across both networks, suggesting they don’t adjust pricing based on network type. This highlights how narrow networks can offer savings, but the benefit depends on which providers employees actually use.
By aggregating and analyzing price transparency data in these ways, consultants can use it to select TPAs and networks. Here are the keys to doing it effectively:
1. Standardize Data: Normalize data to account for variations in pricing, location, and service complexity. Categorize by procedure type, site of care, provider type, and time frame to ensure comparability.
2. Benchmark Against Averages: Compare network prices for procedures with Medicare prices, market averages, or regional benchmarks to identify cost gaps. Also, compare against similar employer organizations to assess performance.
3. Identify Cost Variability: Track price differences across providers for the same procedures and identify outliers. Assess whether higher-cost providers justify their prices with better outcomes.
Verifying Drug Pricing Models
We’ve explored how price transparency data can equip employers and consultants with valuable insights into provider-level pricing and help compare costs across medical networks. But how can this same transparency be applied to the often opaque and complex world of pharmacy benefits?
Because prescription drugs are essentially commodities—and because cost information is not widely accessible—pharmacy has emerged as an ideal target for employers’ transparency initiatives. The TiC Rule originally included a Prescription Drug File requirement to disclose data on drug prices negotiated by plans and providers, but that portion was indefinitely delayed in 2022.
Still, employers and consultants can use existing physician-administered drug prices under the medical benefit included in TiC data today to improve pharmacy oversight. One strategy is to benchmark high-cost injection drug medical claims against publicly available negotiated rates, helping to validate vendor pricing and challenge excessive markups.
Today’s TiC files reveal negotiated rates for prescription drugs billed through the medical benefit. For example, TiC data can show how much a health plan pays different providers for administering the same specialty drug. It also exposes the significant site-of-care price variation: the same drug might cost $3,000 at one location and $9,000 at another. This visibility enables employers to steer members to lower-cost settings and capture meaningful savings.
Additionally, Medicare Part B injectable drugs are now disclosed through hospital MRFs, since hospitals must publish all chargemaster items—including these medications.
Looking ahead, momentum is building to expand drug pricing transparency even further. In February 2025, President Donald Trump issued an executive order to strengthen healthcare price transparency, renewing focus on the long-delayed Prescription Drug File requirement under TiC. Although the Centers for Medicare & Medicaid Services has not finalized guidance for the Prescription Drug File schema, early indications suggest it would include fields such as:
- Pharmacy information (NPI/NCPDP ID, pharmacy name)
- Plan information (plan name, plan type)
- Drug information (NDC code, drug name)
- Pricing information (negotiated rates, historical net price, administration/ dispensing/transaction fees)
- Other billing details (billing codes, place of service)
Two data points stand out as especially important:
- Negotiated rate: The contracted amount paid to an in-network pharmacy, either directly or through a PBM.
- Historical net price: The average actual payment to the pharmacy after accounting for rebates, discounts, chargebacks, and fees.
Requiring historical net price data would be a major breakthrough, exposing the rebate and discount practices that have long been hidden between payers, PBMs, and manufacturers.
Employers and consultants could leverage this transparency in powerful ways, such as:
- Assessing the competitiveness and transparency of TPA and PBM bids;
- Validating and challenging vendor pricing during RFPs; and
- Designing value-based insurance strategies that link drug coverage to real outcomes and net cost efficiency.
Total Cost of Care Benchmarks to Evaluate Care Management Programs
Benefits consultants are increasingly tasked with providing benchmarking data to validate that centers of excellence (COE) and specialty care programs are delivering on promised value. A common request is for resources that help employers assess the market average cost of various bundled or episode-based care procedures within a COE network. As more COE network vendors emerge in the self-funded ecosystem, they curate providers in different specialty areas of care offering bundled pricing, promising more predictable costs and better outcomes for large employers. But how can employers determine how the COE bundled price for an episode of care aligns with the market average for that episode? In essence, the TiC data serves as an independent benchmark showing what a “market price” is for each service in a bundle.
The case study below highlights data requests that are becoming increasingly common as employers seek more data-driven ways to audit vendor pricing, particularly for high-cost services managed through COE programs.
Independent Benchmarking Drives Employer Data Access
This independent cost benchmarking analysis significantly strengthens a consultant’s position with employer clients. Employers can leverage price transparency data to demand more transparency and more detailed claims data from their vendors by:
- Highlighting Gaps in Information: If employers notice discrepancies between the price transparency data (what a service should cost) and the claims data they receive (what they’re actually paying), they can press vendors to provide more detailed claims information. For example, if employees are being charged significantly more for a procedure than what price transparency suggests, employers can ask for a breakdown of why those prices are different.
- Demonstrating the Need for Action: Employers can use price transparency data to show that the current lack of comprehensive claims data hinders their ability to make informed decisions and potentially save money. By demonstrating these inefficiencies, employers can pressure vendors to improve transparency.
- Incentivizing Cost Control: Armed with price data, employers can also push for a more aggressive approach from vendors to control costs and identify patterns that drive up healthcare spending. If an employer sees that a particular service is consistently overpaid or unnecessary, it can demand the vendor take steps to mitigate these costs (e.g., by negotiating better rates with providers or steering employees toward more affordable options).
- Negotiating Better Plan Design: With detailed claims data, employers can make more informed decisions when negotiating plan terms with vendors. This can lead to better plan design that reflects actual employee usage and pricing realities, rather than relying on broad, one-size-fits-all pricing models.